
Overview
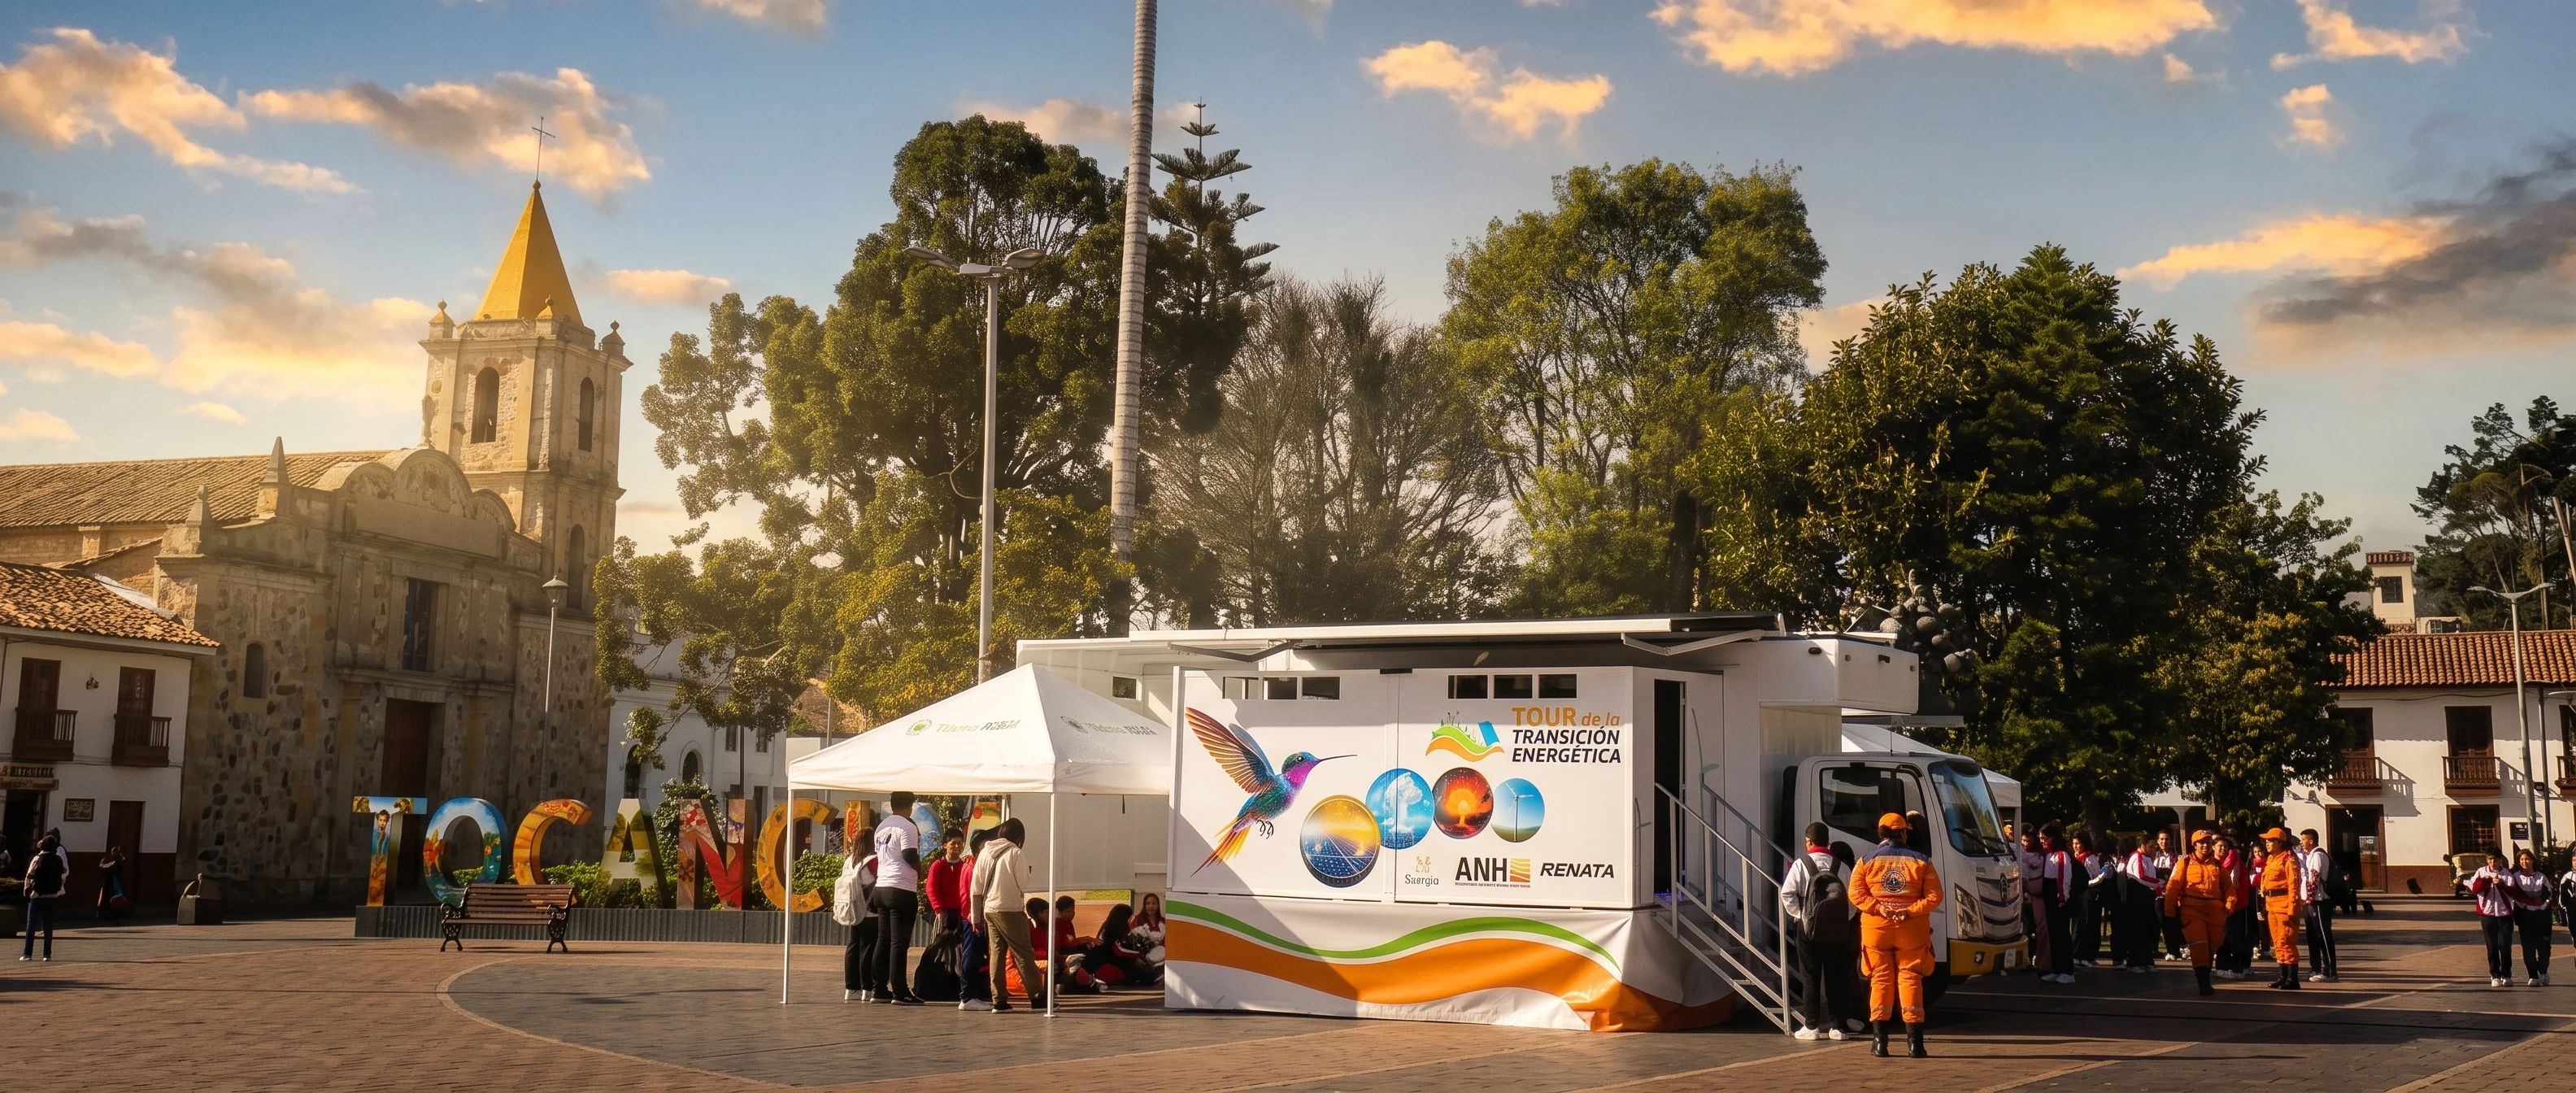
The Energy Transition Tour is a national XR program built for Colombia’s National Hydrocarbons Agency (ANH) to show the country what its government is actually doing about the energy transition.
Colombia has real projects in the ground: hydrogen wells drilled in Boyacá and Córdoba, a geothermal block under exploration in Nariño, wind farms running in La Guajira and an offshore round opening in the Caribbean, solar capacity coming online, and energy communities forming around them. Almost all of it lives in technical reports that nobody outside the sector reads. The ANH wanted a format people could walk into instead.
Twelve immersive experiences across AR, MR, VR and 360°, covering wind, solar, geothermal, natural hydrogen and energy communities. Each one takes a live national initiative and turns it into something a visitor can hold, rotate, take apart and play — without softening the technical content underneath.
And it travels. The program runs in permanent Experience Centers, and in two mobile centers — trucks adapted into XR spaces — that take the tour to cities and towns across Colombia. The audience is not only the one that can reach an exhibition hall in a capital city.
I led the production of five of the twelve: the Energy Evolution VR experience for Meta Quest 3, and the four native Android AR applications — Wind, Natural Hydrogen, Solar and Geothermal.
Role & scope
I was responsible for five of the twelve experiences reaching the field: one VR experience and four native Android AR applications, from the validated content baseline through to the builds installed in the Experience Centers.
That meant running a ten-person multidisciplinary team — three software engineers, three 3D artists, one designer, one sound engineer, one QA and one documentation lead — against a government contract with fixed acceptance windows. I was also the single point of contact with the engineer assigned by the ANH, which made me responsible for translating institutional feedback into production decisions the team could act on, and for defending the ones that weren’t technically viable.
The work I owned directly was the shape of each experience: narrative and script structure aligned to ANH-validated technical content, interaction flow, the UI system underneath all four AR apps, and the feasibility calls about what could actually ship at target performance on the delivery date.
What was delivered
- One VR experience
- Energy Evolution, delivered as two builds: a PC-tethered version for the public launch event, and a standalone Meta Quest 3 build for permanent deployment in the Experience Centers. Six playable energy eras, up to six simultaneous players.
- Four native Android AR applications
- Wind, Natural Hydrogen, Solar, Geothermal, built on ARCore
- One shared UI system
- A single interaction and interface layer forked into four content sets
- Narrative scripts
- For all five experiences, written against institutionally validated source material
- 3D asset package
- Models, textures and optimisation for real-time delivery
- Launch collateral
- App icons, banners and device mockups for the four AR apps
- Deployment and operator documentation
- Supervised and co-authored 25 technical deliverables required for the installation, operation, validation and final sign-off of the XR program. I coordinated documentation across production and QA, ensuring that every deliverable maintained clear traceability and met the technical, compliance and interventoría requirements defined by the ANH.
The last mile
Beyond those five, I supervised the documentation and delivery layer across the full twelve-experience program, keeping production, QA, institutional validation and contractual requirements traceable to each other. On a project with three organisations signing the same artefacts, that trail is what a phase gets paid against.
I presented progress and final builds directly to the client, and trained the instructors who operate the experiences in the field — the people who now run them every day without me in the room.
The five experiences are deployed in permanent Experience Centers and in two mobile Experience Centers built inside adapted trucks, taking the Energy Transition Tour to cities and communities across the country.
A moment of friction
One of many: for the VR experience’s first public presentation, rendering at full fidelity on Quest 3 standalone pushed against the hardware’s limits, so the launch build ran PC-tethered instead — Quest linked by cable to a workstation for the graphics headroom. When the client saw a first-time user managing that cable mid-experience — turning, moving, tangling with it — that became a hard no for unsupervised public deployment. For the launch event, a dedicated operator stayed with each user to manage the cable so movement stayed unrestricted, while the team built a standalone Quest build in parallel. That version — self-contained, no cable, no operator — is the one now running in the permanent Experience Centers.
Design system
One system. Four experiences.
Four AR applications had to be produced in parallel, by one team, against a single contractual delivery date — and had to arrive looking like one national program rather than four separate vendors. A shared system was not a stylistic preference. It was the only way the schedule worked.
The AR layer covers Solar, Wind, Geothermal and Natural Hydrogen. Shared navigation, components, information hierarchy and interaction patterns across all four; colour and content give each one its own identity. One change to a component lands in four apps at once, which is what made four simultaneous builds possible with the team we had.
The Tour de la Transición Energética ships with a fixed institutional palette — eight Pantone colours, each tied to a meaning in the program. These are the official brand colours the AR and VR content is built to sit inside.
- Green 1 Pantone P 142-7 C Sustainability and respect for the environment.
- Orange 1 Pantone 1235 C Energy, momentum and transformation.
- Orange 2 Pantone 1645 C The tour route and the momentum of the project.
- Red Pantone 485 C Geothermal energy within the transition.
- Navy Pantone 2965 C Trust, stability and the energy sector.
- Green 2 Pantone P 157-8 C The natural environment and the commitment to sustainability.
- Teal Pantone 7459 C Technology and energy efficiency.
- Light blue Pantone 291 C The cleanliness and purity of renewable energy.
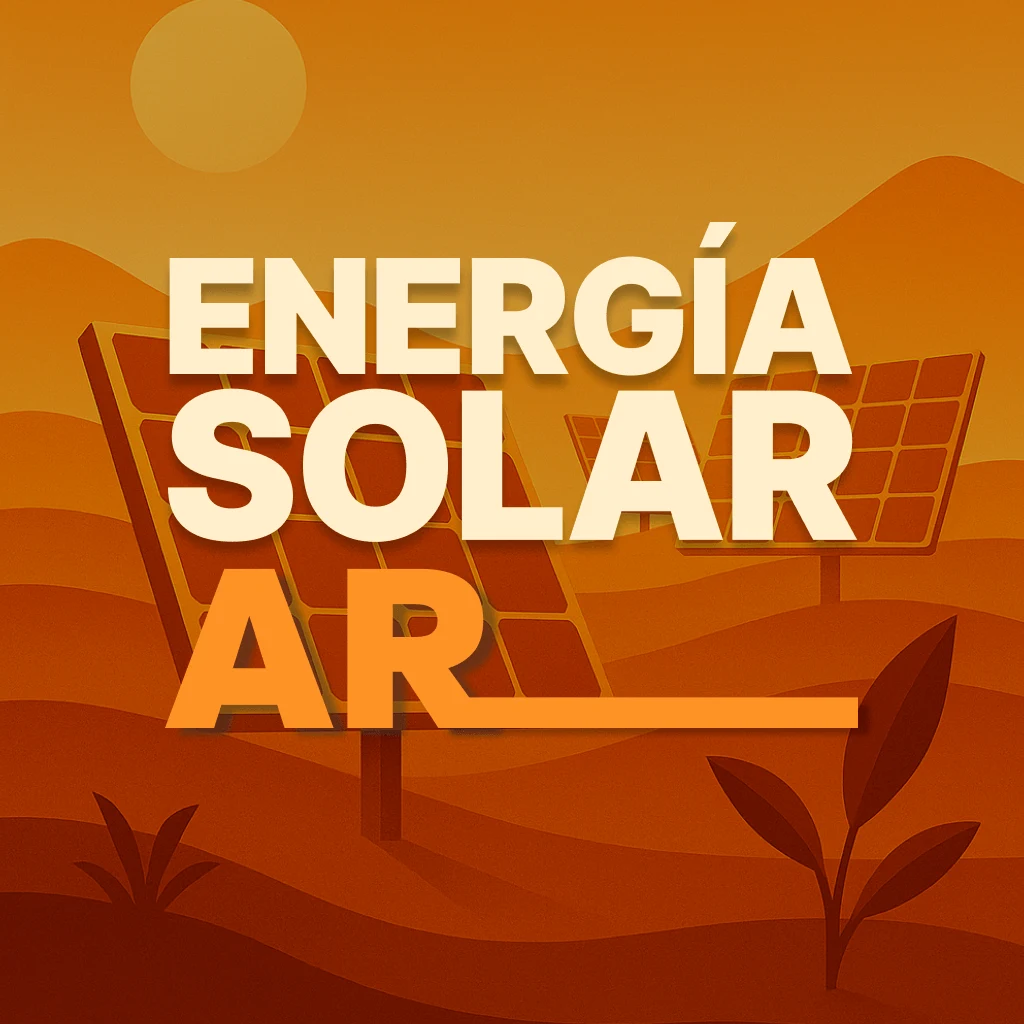
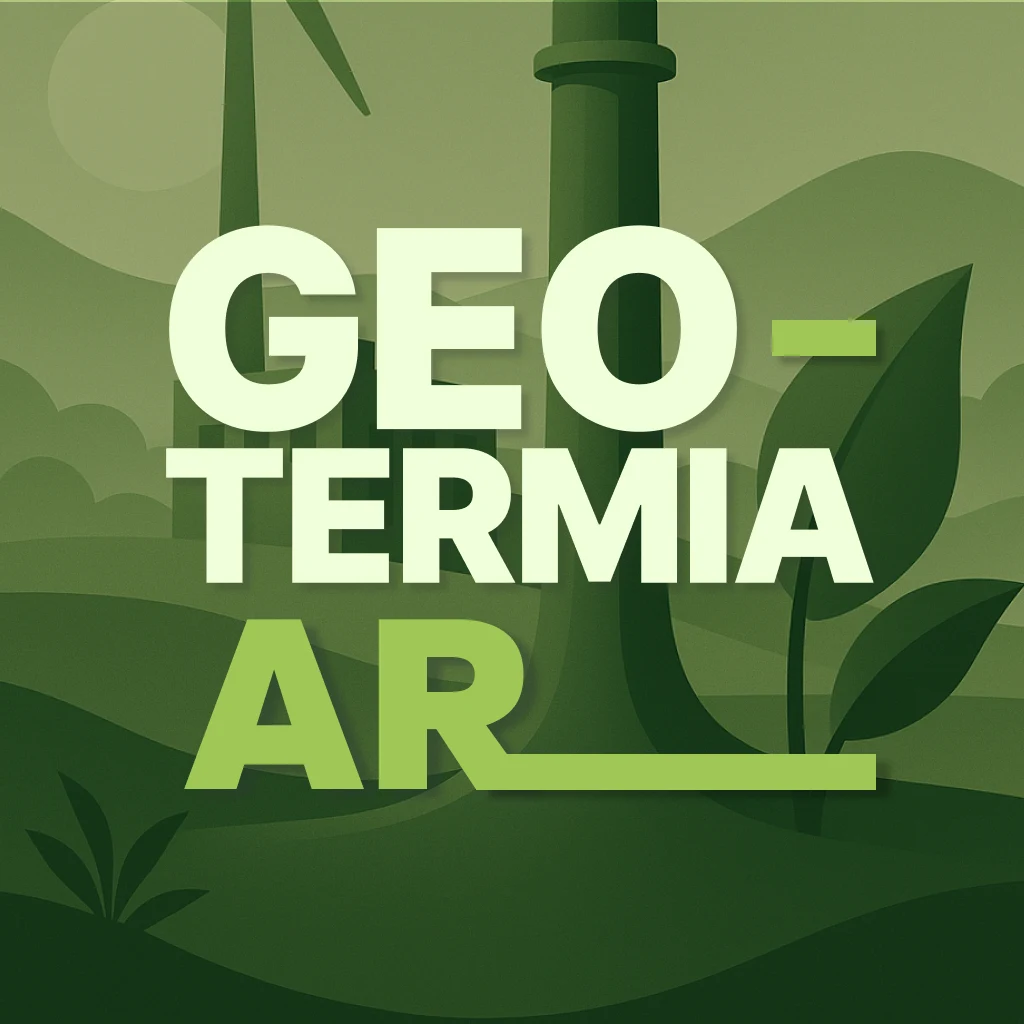
Each experience ships as its own installable app. Five icons — one VR, four AR — drawn in the same illustrative language so they read as one family on the device.
-
 Energy Evolution
Meta Quest 3
-
 Wind
Android · AR
-
 Natural Hydrogen
Android · AR
-
 Solar
Android · AR
-
 Geothermal
Android · AR
Apps mockups
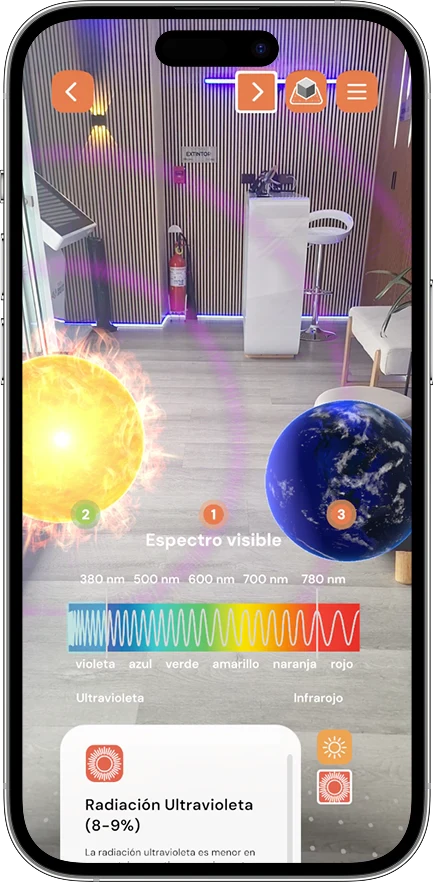
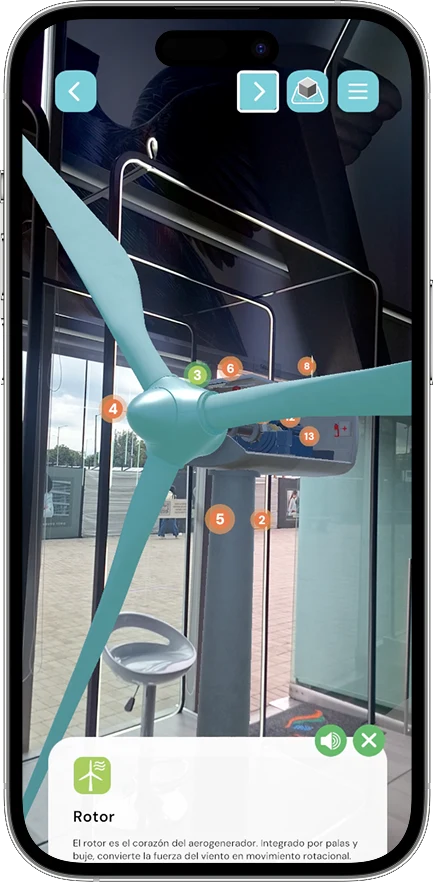
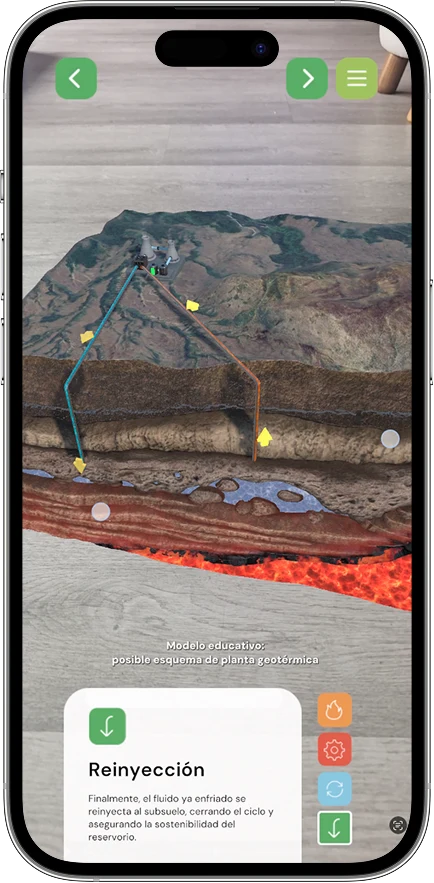
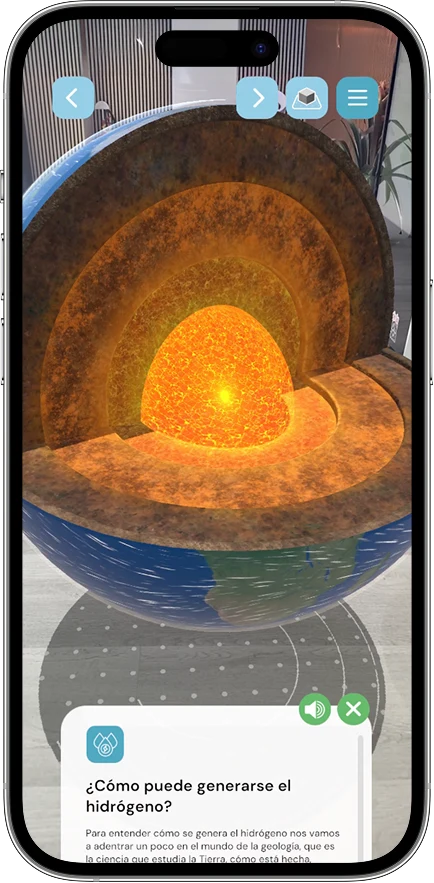
The four AR experiences as they run on an Android phone — one shared interface shell, recoloured and refilled for each subject. The same navigation sits at the top and the same contextual card at the bottom; only the 3D content and the palette change from one app to the next.
-
Solar
-
Wind
-
Geothermal
-
Natural Hydrogen
PrincipleThe screen is a caption. The world is the content.
AR changes the relationship between interface and content. The 3D object placed in the physical environment is the experience — the UI exists to guide, explain and get out of the way.
The system keeps navigation at the top and contextual information at the bottom, leaving the centre of the frame clear for the AR content. Prompts appear only when an action is required, and information can be dismissed whenever the visitor wants to return their attention to the scene.
One system underneath. Different worlds on top.
The experiences
Five experiences, each with its own logic. Video walkthroughs sit alongside these — the stills here show the structure, not the whole flow.
-
01 · VR · Meta Quest 3 · up to 6 players · ~20 min
Energy Evolution
- Function
- Six energy eras, played rather than read. Up to six people share the same lobby, pick from eight avatars, type their name on a floating keyboard and start together — or the experience starts on its own after a 60-second wait. A holographic guide called Aether walks the group from the first controlled fire at Koobi Fora to the wind farms of La Guajira. Each era is roughly three minutes and ends in a cooperative minigame: rubbing a fire drill in rhythm, stacking a charcoal kiln, loading coal wagons, closing electrical circuits, assembling pipeline, aligning turbines to the wind.
- Why
- The through-line is a single number. Every era logs what it costs in CO₂ — 18.3 kg from ten kilos of wood, 2,569 kg from a tonne of mineral coal, zero from wind — and the counter is on screen the entire time. Nobody is told the lesson; they watch the number climb for five eras and stop in the sixth. Design focus: a HUD that stays readable in a headset while six people talk over each other, and a per-era rhythm consistent enough that the interface disappears by the second era.
Video -
02 · AR · Android · ARCore · ~5–7 min
Wind
- Function
- Opens on an extruded 3D map of Colombia with La Guajira lit up, then places a scale horizontal-axis turbine on the table in front of you. Fourteen tappable components, each with its own narration — blades start turning above 3 m/s and peak between 12 and 15; the rotor turns 10–20 times a minute while the generator passes a thousand rpm through the gearbox. Then it zooms back out: onshore versus offshore, and the actual Colombian portfolio — Guajira 1, WESP-01, Jepírachi, the Alpha and Beta projects under construction, and the Caribbean offshore round — each one converted into the only unit that means anything to a visitor: how many homes it powers.
- Why
- Design focus: the fourteen-state hotspot pattern — the densest technical content in the program delivered without a single wall of text.
Video -
03 · AR · Android · ARCore · ~5–7 min
Natural Hydrogen
- Function
- The hardest subject in the set, because most visitors have never heard of white hydrogen — hydrogen already sitting free underground, no industrial pyrolysis required. It starts with a floating chocolate-chip cookie: the cookie breaks apart to show that a rock is a solidified conglomerate of separate minerals, and from there the app can explain the three geological mechanisms that release free hydrogen — serpentinisation, radiolysis and thermal maturation — each as its own anchored 3D diagram rather than a paragraph. Then the three phases of prospecting — exploration, evaluation, extraction — with the three core samples that matter: serpentinite source rock, porous sandstone reservoir, dense shale seal. It closes on the ANH official wells: Macanal-1X in Boyacá, where 27 samples showed free hydrogen up to 30,000 ppm; San Rafael-1X and 2X in Córdoba; Une-1X and Fómeque-1X.
- Why
- Design focus: a metaphor-first opening for an unfamiliar subject, then escalating to real well data without changing the screen structure once.
Video -
04 · AR · Android · ARCore · ~5–7 min
Solar
- Function
- The only app in the set with a live simulator in it. It opens on the spectrum — visible light at 46–47%, infrared at 44–46%, ultraviolet at 8–9% — animated as wavelengths rather than listed as percentages, then covers the five uses: photosynthesis, photovoltaic, solar thermal, concentrated solar, and passive solar design. The centre of the experience is the irradiance panel: two sliders — time of day and panel tilt — recalculate the angle of incidence and instantaneous irradiance in real time against a live curve, from 1,361–1,367 W/m² at the top of the atmosphere to roughly 1,000 W/m² at ground level to hit nominal efficiency. It lands on the one question a visitor actually has: how many panels does my house need? At the Colombian average residential consumption of 157 kWh/month, five to six 330 W panels — a 3D house, panels on the roof, answered.
- Why
- Design focus: an interactive data panel dropped inside an AR flow without breaking the shell — the only screen in the program where the UI is allowed to take over the frame.
Video -
05 · AR · Android · ARCore · ~5–7 min
Geothermal
- Function
- The only baseload story in the set, and the argument the app is built to make: geothermal runs 70–90% of the year, unlike wind and solar. It anchors on the Azufral volcano in Nariño — 4,070 m, the Laguna Verde — and cuts the terrain open to walk through the binary organic Rankine cycle in four steps: heating, production, generation, reinjection. Brine at 90–150 °C surfaces, hands its heat to a working fluid with a lower boiling point, that fluid drives a turbine, and the brine goes back down. Closed loop, nothing vented. Then the institutional layer — actors, the ANH, permits, exploration, today — as five numbered hotspots on the volcano itself rather than a timeline slide. It closes on a vertical timeline: 2022, 2023, Resolution 40320 of July 2025 authorising Ecopetrol on the Azufral001 block, the auction in preparation, and the pilot. 148 km², a projected 80 MW, roughly 160,000 homes, roughly 640,000 tonnes of CO₂ a year not emitted.
- Why
- Design focus: two different navigation models in one app — a linear cross-section walkthrough for the physics, spatial hotspots for the governance — without the visitor noticing the switch.
Video
Process
Four contractual phases, run as a hybrid: PMI-standard process for the deliverable trail, agile iteration inside each experience. Every screen existed as a Figma frame with a written rationale before anyone wrote code — which is what made the documentation supervision possible in the first place.
-
phase 01
Research & contextualisation
- Function
- Technical, geological and territorial source material collected, structured and validated as a baseline before a single frame was drawn. Scripts, geophysics, and the numbers each experience would have to carry.
- Why
- Output: validated content baseline and narrative scripts.
-
phase 02
Pre-production & design
- Function
- Conceptual design and technical software architecture for all twelve scenarios. High-resolution concept renders, storyboards, and the software iteration validation records. This is where the AR shell was defined once and forked into four token sets.
- Why
- Output: conceptual design, technical architecture, storyboards, validation records.
-
phase 03
Development & production
- Function
- The asset package — 3D models, audio, animation rigs, UI — and the optimised, shippable builds. Continuous design QA against the Figma source across build iterations.
- Why
- Output: asset package and production builds.
-
phase 04
Implementation & dissemination
- Function
- Hardware deployment documentation, operator and visitor manuals, and the institutional visibility strategy — app icons, launch banners, device mockups.
- Why
- Output: deployment docs, manuals, launch collateral.
Running underneath all four: QA documentation — test plans, test architecture, change control logs and sign-off certificates, per technology vertical; traceability — a single naming and versioning convention across three organisations, so no artefact was ever ambiguous about who produced it, when, or which version was approved; and design QA — builds checked against the Figma source before every acceptance review.
Community
Who this was built for
The program was commissioned to reach everyone with a stake in Colombia’s energy transition — which in practice means four very different rooms, often on the same day.
Institutions and decision-makers. Ministries, agencies and energy companies who need to understand where hydrogen, geothermal or offshore wind sit in the national transition — alongside national and international partners and investors evaluating whether these projects are viable enough to fund. This audience is why no technical figure was softened: the well depths, the ppm readings, the megawatts and the plant factors all stayed in.
Academic and technical. Universities, researchers and students in energy, engineering and sustainability, who need validated, current information rather than a summary. And internal technical teams at public and private entities, using the experiences as training and awareness material.
Local communities and the general public. People living near the identified wells and exploration blocks, and citizens who simply want to know what is being built in their country. This is the audience the mobile Experience Centers exist for — two trucks that carry the program to cities and towns instead of waiting for them to travel to it.
Visitors at fairs and institutional events. Walk-up audiences with a few minutes and no XR background, in a public setting, usually with an on-site guide.
Those four rooms have almost nothing in common except the time they can give you. Which is why every AR experience is readable in five to seven minutes at the surface, with the full technical layer one tap deeper — the same hotspot pattern that takes the wind turbine apart works for a visitor with four minutes and for one evaluating an investment. The visitor who wants the headline gets it. The other can go all the way down.
Key challenges
-
Four sciences, one product
- Problem
- Four AR apps covering wind, hydrogen, solar and geothermal, on a shared institutional program, with four separate content teams and four separate 3D pipelines. Built independently they would have looked like four unrelated products and cost four times the maintenance.
- Decision
- One AR shell — identical structure, components, gestures and card anatomy — with colour as the only fork. One accent per experience, everything else shared. The fourteen-component turbine module became one screen with fourteen states instead of fourteen screens, proving the pattern held under the densest content in the program.
- Outcome
- Four apps shipped from one system. A visitor who learns one has learned all four; a change to the card component lands in every app at once.
-
Contract-grade content in a five-minute attention span
- Problem
- The source material was written for an institutional contract: drill depths in feet, ppm of free hydrogen, W/m² of irradiance, organic Rankine cycle thermodynamics. None of it could be cut — the ANH needed the technical claims intact — and none of it could be read by a walk-up visitor in five minutes.
- Decision
- A fixed three-beat rhythm: prompt card asks a question, 3D object answers it in space, info card carries the detail for whoever wants it. Depth moved into hotspots instead of pagination. Every unit converted into homes powered or tonnes not emitted. And a menu screen so no visitor is ever trapped mid-flow.
- Outcome
- Every experience readable in five to seven minutes at the surface, with the full technical layer one tap away and nothing removed from the source.
-
A twelve-experience program that had to stay traceable
- Problem
- Twenty-five contractual deliverables, four phases, three organisations signing off, and four QA document sets per technology vertical. Design decisions living in people heads instead of documents is how institutional projects lose a phase.
- Decision
- Every screen documented as a Figma frame with a written rationale before development. A single naming and versioning convention across all parties. Design QA against the Figma source before each acceptance review rather than after.
- Outcome
- Documentation supervised across all twelve experiences and four phases, with an artefact trail that matched what was actually built.
Results
Delivered under contract 122571-003-2025 for the ANH, through RENATA and GMS SAS. Visitor and adoption metrics from the Experience Centers are still coming in — this section grows as real numbers land.
What's next
The Energy Transition Tour demonstrated how XR can transform complex institutional content into experiences people can enter, explore and understand.
The biggest lesson for me was that at this scale, design is more than the interface. It is the connective layer between content, technology, people and production.
Twelve experiences, multiple technologies and three organisations only become one coherent product when that connection is designed intentionally.
Technology is the medium. Experience is the product.